Program structure
Functionally, the GUI is very similar to existing programs for extracellular data acquisition. It allows you to control input sources, adjust filter settings, visualize spikes and LFPs, and save all of your data to disk. Conceptually, however, the GUI is more similar to audio processing applications, such as Ableton Live. Rather than hard-coding the signal chain, the processing pathway can be created dynamically by the user. This feature will hopefully make the GUI easier to comprehend, less painful to modify, and more enjoyable to use than anything that currently exists for neuroscience. While most open-loop electrophysiology experiments require roughly the same signal chain, closed-loop experiments rarely do. A more flexible user-interface will allow neuroscientists to build up a library of modules that can be re-used and shared, rather than relying on purpose-built code in Matlab or LabVIEW that's used for one experiment then scrapped.
To that end, everything about the GUI revolves around the ProcessorGraph, which is a subclass of Juce's AudioProcessorGraph. A list of available inputs, filters, and visualizers/outputs is presented in the ProcessorList, which are dragged into the EditorViewport to construct the signal chain. The ProcessorGraph then takes care of the behind-the-scenes operations of connecting the individual modules and making sure they can process data in the right order during acquisition. By structuring things around a flexible ProcessorGraph, the application makes few assumptions about what the user wants to do. Therefore, the GUI can be useful for things that don't involve electrophysiology at all: controlling trial structure for behavioral experiments, delivering open-loop optogenetic stimuli, or providing online feedback based on position data. Of course, the GUI's true power comes in its ability to easily condition stimuli based on neural events.
Anatomy of the user interface

Here's what the GUI looked like in February 2012. It's more polished now, but the layout is basically the same. The interface was modeled on that of audio recording software such as Ableton Live that allow the user to access all of the important tools from within a single window. Visualizers can be placed in their own windows if screen real estate isn't scarce, but we also wanted the GUI to be easy to navigate when it's being used on a laptop or a computer with a single display.
Building the signal chain involves dragging the name of a particular processing module from the list at the left onto the viewport at the bottom of the screen. The location at which it's dropped determines its order in the processing chain. The processors know what they can and can't connect to. For example, if a source is dropped in the middle of an existing signal chain, it automatically creates its own chain. If a sink is placed before a filter, it slices the signal chain at that point and moves the extra processors into their own signal chain. This functionality may be confusing for new users, so it would be ideal to add some animations that make it clear what's occurring in these cases.
Overall program structure
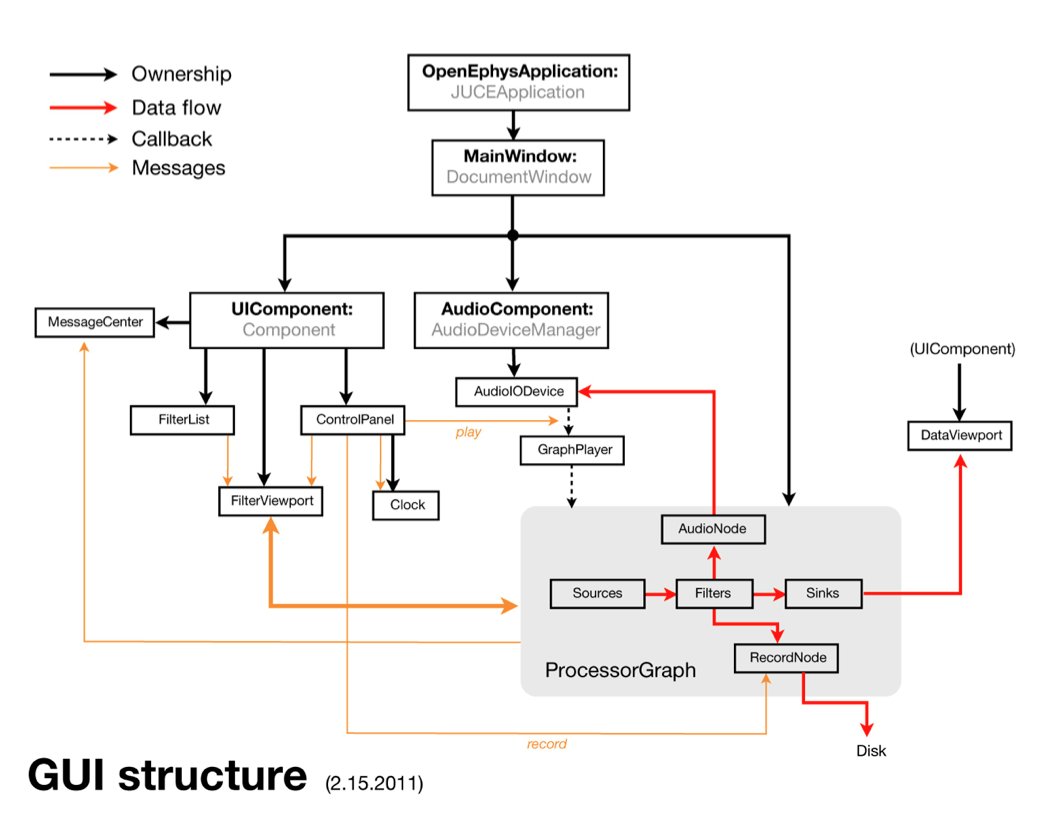
This flowchart diagrams the essential interactions between the main classes of the GUI.
Solid black arrows denote ownership: which objects are responsible for creating and destroying other objects?
Dashed black arrows indicate the precisely timed callbacks that drive data acquisition.
Red arrows show how neural data flows through the application. All of the data processing takes place within the ProcessorGraph, but may leave the graph to be stored to disk by the RecordNode, sent to the audio monitors by the AudioNode, or visualized within theDataViewport. Efforts have been taken to make everything outside of the ProcessorGraph as general as possible. Thus, extending the functionality of the GUI will only involve creating new processing modules, rather than modifying the rest of the source code.
Orange arrows denote the essential message-passing interactions. The messages sent between the EditorViewport and theProcessorGraph are especially important, as they are responsible for constructing and verifying the signal chain.
Core of the application

When the application starts, the first object created is an OpenEphysApplication, which is derived from the JUCEApplication class. This object initializes the application and owns the MainWindow, but doesn't do much else. When the MainWindow is created, it creates the three central objects of the application: the UIComponent, the AudioComponent, and the ProcessorGraph.
The UIComponent owns all of the objects the user can interact with directly. Editing the ProcessorGraph, starting and stopping acquisition, and receiving updates about the application's state is all handled by objects created by the UIComponent. It is derived from Juce's Component class
The AudioComponent communicates with the computer's audio card, which drives the callbacks to the ProcessorGraph and enables audio monitoring of neural signals. It is derived from Juce's AudioDeviceManager class.
The ProcessorGraph stores information about the signal chain and ensure that data is processed efficiently. It is derived from Juce'sAudioProcessorGraph class.
User-interface classes

The UIComponent has five main regions, each of which is an object that it is responsible for creating and destroying:
The ControlPanel occupies the top of the application window. It contains a CPU usage meter, a disk space meter, a play button, and a record button. It also own the Clock, which displays the total time spent acquiring or recording data.
The ProcessorList sits on the left-hand side of the application window and contains a list of all the available modules for creating and processing data. Modules are selected from the list and dragged onto the EditorViewport to construct the signal chain. The ProcessorList can be collapsed to provide additional room for data visualization once the signal chain is in place.
The EditorViewport, near the bottom of the application window, displays the editors for all of the monitors currently in the signal chain. The editors provide a graphical interface for modifying the parameters of each module. Once they're inside the EditorViewport, editors can be dragged and dropped to change their ordering within a signal chain, but only if acquisition is paused.
The MessageCenter lives at the bottom-right of the application window and displays messages that are relevant to the user. Most of these messages currently originate in the ProcessorGraph, but they could come from almost any object within the program.
The DataViewport contains tabs with OpenGL visualizers. Whenever a new visualizer is added to the signal chain, it can either claim a tab within the DataViewport or place its display in a separate window. This affords the GUI incredible flexibility. In a setup with multiple monitors, each visualizer can occupy a separate window on its own screen. If the GUI is being used on a laptop, all of the visualizers are organized into easy-to-find tabs.
The processor graph

The ProcessorGraph is the heart of the GUI. Thanks to Juce's amazing AudioProcessor class, the creation of arbitrarily complex signal chains is vastly simplified. All of the modules that create the ProcessorGraph are derived from a custom GenericProcessor class.
There are four main types of user-selectable modules that can be placed in the ProcessorGraph:
Sources feed data into the graph. They can only have outputs, never inputs. Examples of sources include the SourceNode, which communicates with external data sources, and the EventNode, which emits events at defined intervals. Every signal chain must have at least one source.
Filters modify the data they receive. They can be as simple as bandpass filters or resamplers, or more complex spike detectors or ripple/spindle detectors. Filters can process continuous signals or discrete events.
Sinks take data and do something with it. They can only have inputs, never outputs (at least within the ProcessorGraph). Examples of sinks include LFP displays, spike displays, and network signaling nodes.
Utilities (not shown) allow signal chains to be combined or split. Robust utility classes are still under construction.
In addition to the user-defined signal chain, two modules are there by default:
The AudioNode will allow signals to be sent to the computer's audio card, for purposes of audio monitoring. It's still under construction.
The RecordNode starts writing data to disk when recording is active. It's also under construction.