LFP Viewer
- Josh Siegle
- Josh Siegle
- Jakob Voigts
IMPORTANT: The Open Ephys GUI documentation has migrated to a new site – please visit https://open-ephys.github.io for the most up-to-date information.
Function
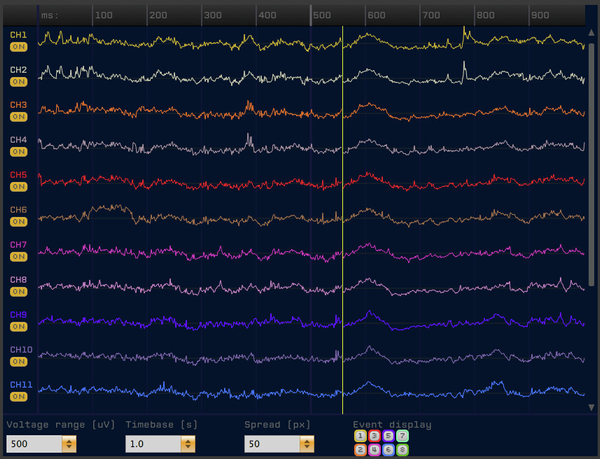
Displays continuous signals. Allows the user to change the display gain (voltage range), the display width (timebase), and the distance between individual channels (spread).
Event display buttons: determine whether particular event channels are overlaid on the LFP display. Disabling channels that are on for long periods of time can make the display look nicer.
Color grouping: used to keep the same display colors for blocks of channels (helpful if you're recording in stereotrode or tetrode configuration)
Invert button: yellow if the LFP signals are inverted so that spikes point up
Drawmethod button: yellow if a simplified drawing method is used (causes aliasing of spikes, but may render faster)
Pause button / Space: pauses the LFP display without stopping acquisition. When it's pressed again, the display goes back to real time.
Shift + Scroll wheel: Increase / Decrease the voltage range.
Ctrl+ Scroll wheel: Increase / Decrease the spread.
Known bugs
If other visualizers are open, or processing load is high, the LFP viewer may not display samples for a brief period; this does not affect anything in the data acquisition pipeline, only what appears on the screen
The channel selector buttons in the PARAMS tab currently serve no purpose (they should either be given a purpose or removed).
Upgrades needed
It would be sweet to have a buffer that allows the display to be paused and scrolled backwards while data acquisition continues. Also, if a triggered-average display could be integrated into the LFP viewer, it would be a dream come true.